Consolidated passbook

Consolidated passbook

Consolidated passbook

Redesigning Stable Money's fragmented passbook into a unified portfolio view that builds trust, keeps users informed, and drives organic cross-sell — without feeling like marketing.

Role

SENIOR PRODUCT DESIGNER;
END TO END OWNERSHIP of UX & UI interaction design & Strategy

Duration

1 month • DEC'25
THE PROBLEM

A passbook built around products,
not the people using them.

A passbook built around products,
not the people using them.

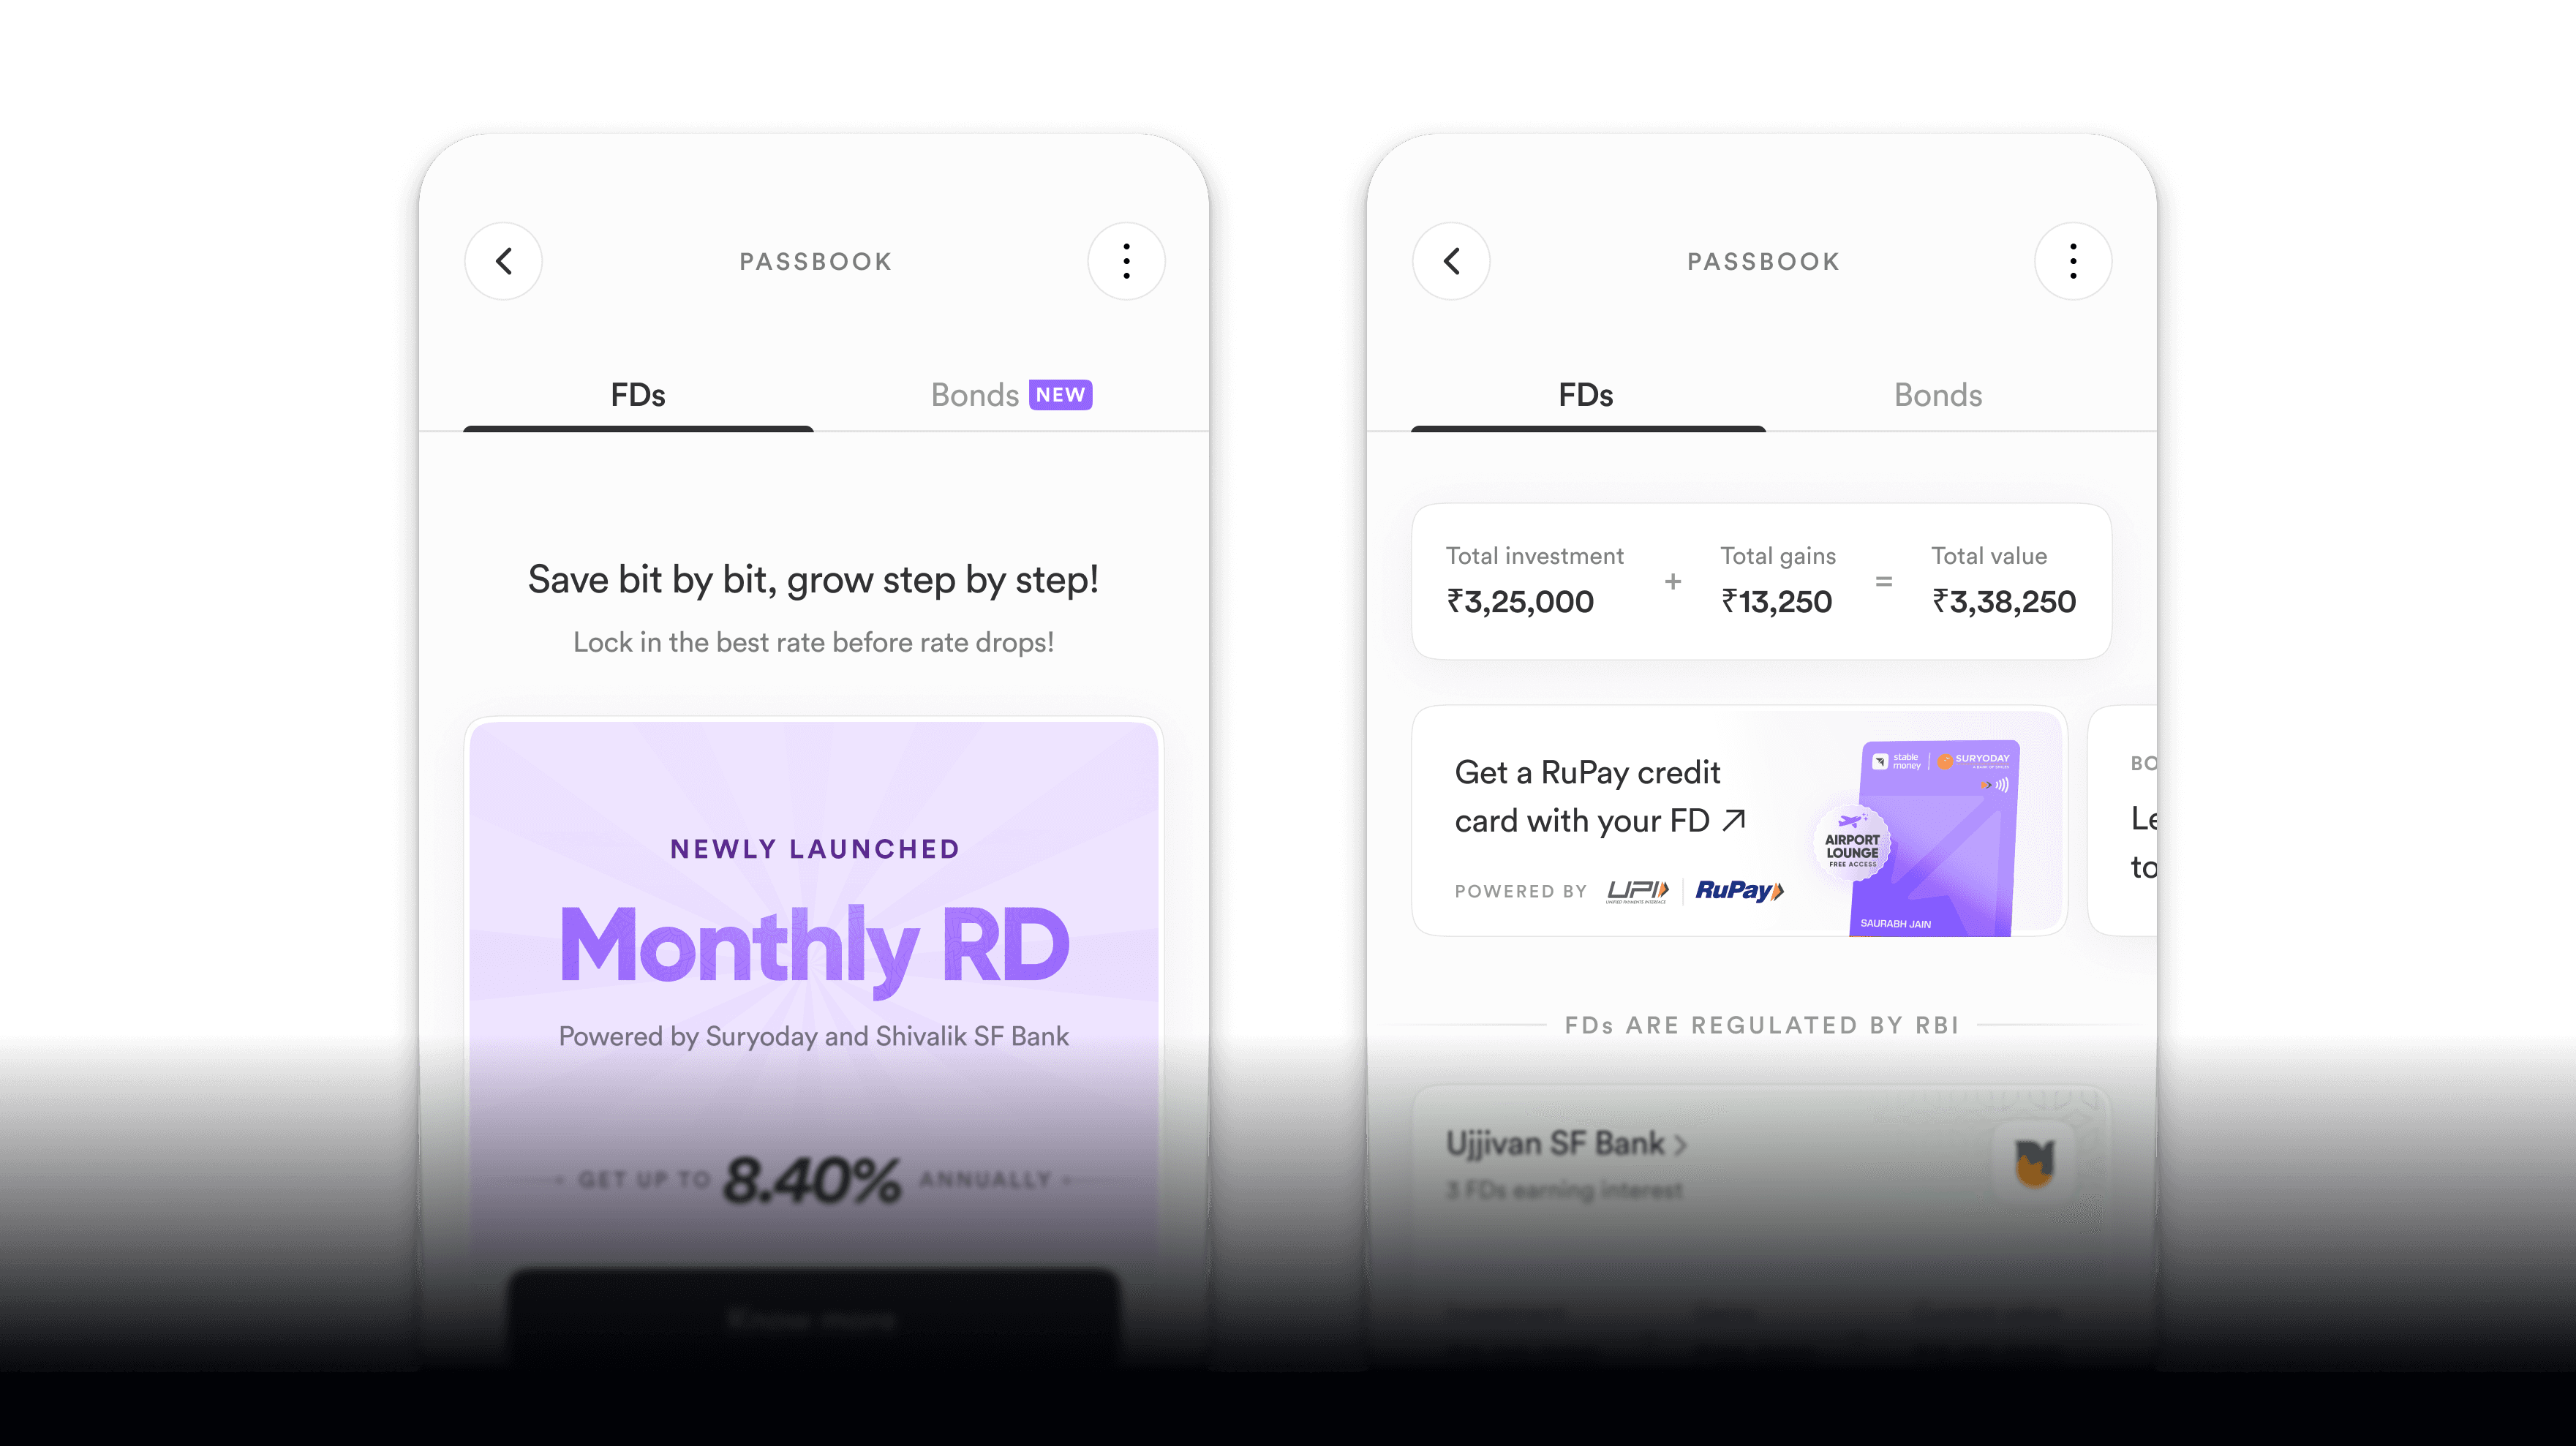
The structure was simple, one tab per investment category. It worked when there were two products. When Gold & Silver launched as the third, the cracks became impossible to ignore — and every future product launch would make it worse.
Products invisible to each other

Products invisible to each other

Products invisible to each other


A user invested only in FDs had no reason — and no path — to discover Bonds or Gold & Silver. The passbook reinforced silos instead of breaking them.


A user invested only in FDs had no reason — and no path — to discover Bonds or Gold & Silver. The passbook reinforced silos instead of breaking them.


A user invested only in FDs had no reason — and no path — to discover Bonds or Gold & Silver. The passbook reinforced silos instead of breaking them.

No portfolio-level view

No portfolio-level view

No portfolio-level
view


Users had to mentally add up three tabs to understand what their money was doing. Most didn't. Total net worth was invisible.


Users had to mentally add up three tabs to understand what their money was doing. Most didn't. Total net worth was invisible.


Users had to mentally add up three tabs to understand what their money was doing. Most didn't. Total net worth was invisible.

Doesn't scale, by design

Doesn't scale, by design

Doesn't scale,
by design

Every new product Stable Money launches adds another tab. The fragmentation compounds with each launch. This wasn't a fixable edge case — it was structural.


Every new product Stable Money launches adds another tab. The fragmentation compounds with each launch. This wasn't a fixable edge case — it was structural.


Every new product Stable Money launches adds another tab. The fragmentation compounds with each launch. This wasn't a fixable edge case — it was structural.

USER NEEDS

Why do people visit the passbook?

Five core jobs-to-be-done shaped the design north star.

📊 Check the status of my investments and returns

✅ Verify that a booking, maturity, or withdrawal went through

📅 Know when the next event happens — maturity, payout, SIP installment

📅 Know when the next event happens — maturity, payout, SIP installment

⚡ Take the next action on an existing investment

🔍 Revisit my portfolio to decide what to invest in next

Project context

The brief was a passbook redesign.
The real problem was invisible opportunity.

The brief was a passbook redesign.
The real problem was invisible opportunity.

•

Why it got prioritised

•

The tension I had to navigate

•

The constraints that shaped every decision

•

The constraints that shaped every decision

Success Metrics

What we're optimising for. What we're protecting.

What we're optimising for. What we're protecting.

1

Sessions & PB visits/user

2

New category conversion

3

Overall transactions/user

4

Conversion & AUM on platform

Guardrail

AUM and conversion in existing categories must not drop. Cross-selling a new category at the cost of cannibalising existing behaviour is not a win. This guardrail shaped every cross-sell design decision.

Competitive Analysis

What the market told us.

What the market told us.

We benchmarked eight apps — Public, Plum, Acorns, Quicken, Kraken, Yahoo Finance, Plata, and Origin. Rather than cataloguing each app, here's what we actually walked away with: four design decisions, each shaped by something we saw.

Portfolio header

One big number.
Gains right below it.

Public leads with total portfolio value and shows all-time gain/loss directly beneath — one visual unit.


Plum does the same: "Your Plum value · £142.83 · ▲ £23.91 past week."

Both confirm the same hierarchy works. We adopted it as-is for the Stable Net Worth header.

Category breakdown

Rows, not charts.
Asset type, not instrument.

Public breaks portfolio into named asset rows. No pie chart. Readable at a glance.

Kraken shows portfolio growth over time


Yahoo Finance have raw data overload. Fluctuating numbers and red signals create anxiety, not clarity.


For an FD/bond audience that holds for months, rows win every time.

Category breakdown

Rows, not charts.
Asset type, not instrument.

Public breaks portfolio value into named asset rows (Stocks, Bonds, Cash) — no pie chart. Kraken shows a live price chart with time selectors instead. Public's approach is readable at a glance; Kraken's creates volatility stress. For an FD/bond audience that holds for months, rows win every time.

Zero state
Upcoming events

Make the empty state
earn its keep.

Investment-native reminders.
Not a task manager.

Public's zero state uses compounding math to make inaction feel costly — "If you invested $500 ten years ago, you'd have $1,600 now."

Acorns keeps the surface alive even at $0, showing a Performance card so the product feels real before use.

Both principles made it into our design: real numbers + anticipation of value.

Quicken has a Reminders section — the right idea, wrong execution. It lists insurance payments, subscriptions, and bills alongside investments. We took the concept of surfacing upcoming obligations but scoped it tightly to investment events only: maturity dates, SIP installments, payout dates. Anything else belongs on a different surface.

Upcoming events

Investment-native reminders.
Not a task manager.

Quicken has a Reminders section. It lists insurance payments, subscriptions, and bills alongside investments.


We took the concept of surfacing upcoming obligations but scoped it tightly to investment events only: maturity dates, SIP installments, payout dates. Anything else belongs on a different surface.

Design Process

Three phases. Three different questions.

Three phases. Three different questions.

PHASE 1

What tone should this feel like?

I explored two directions in parallel — a gamified PRO model (progress rings, laurel wreaths, achievement tiers) vs. a transparency-first model (number-forward, information-dense, no theatre).

DECISION

Moved away from gamification. Stable Money's trust is built on clarity. A passbook that leads with achievement signals rather than real data would undermine the product's core promise — especially for users with mixed portfolio performance.

PHASE 2

Where does the overview live?

Two structural options: embed the overview as a section inside the existing passbook scroll, or give it a dedicated "Overview" tab alongside FDs, Bonds, Gold & Silver.

DECISION

Overview as a first-class top-level tab. It doesn't disrupt what existing users already know, it's self-updating as new products launch, and it signals clearly that this is a different kind of view — not just more scroll.

PHASE 3

How do the details behave?

With structure decided, iteration focused on: gains display logic for volatile assets, the animation system for networth, event card hierarchy, and how cross-sell nudges should read and feel.

DECISION

Every detail had a rule.

  • Gains show conditionally based on sign.

  • Animation runs once per session.

  • Events are chronological with one priority card.

  • Insights are grounded in real user data — never generic.

Key Decisions

THE CHOICES THAT SHAPED THE DESIGN

THE CHOICES THAT SHAPED THE DESIGN

Decision 1

Additive, not overhaul

Decision 2

Gains logic for volatile assets

Decision 3

What we deliberately left out

Decision 4

Zero state as a conversion surface

Cross-sell Philosophy

We don't push. We inform.

We don't push. We inform.

The hardest product design question on this project wasn't layout — it was philosophy. What does responsible cross-sell look like in a financial app?

❌ WHAT we rejected

"Bond NW = 0. Invest now to keep earning returns."

✅ WHAT WE BUILT

"You stopped earning ₹128 monthly since 2nd October since your bond matured. Explore more."

Every insight is grounded in a real number from the user's portfolio. We equip users with information to reach their own conclusion — and that approach also builds the trust that makes them act on it.

v1 shipped. v2 defined.

Defining what stays out of v1 is as important as defining what goes in. A tighter v1 with high confidence beats a bloated one with risk.

Overview tab with Stable Net Worth header + animation
Quick Insights cross-sell card (dismissible, data-grounded)
Portfolio allocation by category with gain/loss signals
Zero state — category tiles, social proof, aspiration hook
Upcoming Events — T+30 window, max 4 cards, one priority CTA
Orange dot indicator for in-progress orders
Overview tab with Stable Net Worth header + animation
Quick Insights cross-sell card (dismissible, data-grounded)
Portfolio allocation by category with gain/loss signals
Zero state — category tiles, social proof, aspiration hook
Upcoming Events — T+30 window, max 4 cards, one priority CTA
Orange dot indicator for in-progress orders

Planned for V2


→ Hide/unhide investment values toggle


→ Calendar view for all upcoming events (View All destination)


→ AI/ML-powered dynamic insight engine


→ Orange dot on section headings within Overview


→ Secured credit card passbook integration

+30.9%

+30.9%

Increase in user sessions

Increase in user sessions

+16%

Increase in transactions per user

Increase in transactions per user

~3x

~3x

Discovery of new categories

Discovery of new categories

REFLECTION

What I learned.

1

Back your conviction, but design the fallback first

2

Talk to devs early. Then stay sharp when things still break.

3

Some right ideas need data before they can win

Portfolio header

One big number.
Gains right below it.

Public leads with total portfolio value and shows all-time gain/loss directly beneath — one visual unit. Plum does the same: "Your Plum value · £142.83 · ▲ £23.91 past week." Both confirm the same hierarchy works. We adopted it as-is for the Stable Net Worth header.

Category breakdown

Rows, not charts.
Asset type, not instrument.

Public breaks portfolio value into named asset rows (Stocks, Bonds, Cash) — no pie chart. Kraken shows a live price chart with time selectors instead. Public's approach is readable at a glance; Kraken's creates volatility stress. For an FD/bond audience that holds for months, rows win every time.

Zero state

Make the empty state
earn its keep.

Public's zero state uses compounding math to make inaction feel costly — "If you invested $500 ten years ago, you'd have $1,600 now." Acorns keeps the surface alive even at $0, showing a Performance card so the product feels real before use. Both principles made it into our design: real numbers + anticipation of value.

Upcoming events

Investment-native reminders.
Not a task manager.

Quicken has a Reminders section — the right idea, wrong execution. It lists insurance payments, subscriptions, and bills alongside investments. We took the concept of surfacing upcoming obligations but scoped it tightly to investment events only: maturity dates, SIP installments, payout dates. Anything else belongs on a different surface.

Zero state

Make the empty state
earn its keep.

Public's zero state uses compounding math to make inaction feel costly — "If you invested $500 ten years ago, you'd have $1,600 now." Acorns keeps the surface alive even at $0, showing a Performance card so the product feels real before use. Both principles made it into our design: real numbers + anticipation of value.

REFLECTION

WHAT I LEARNED

1

The biggest decisions weren't screen-level.

2

Transparency and cross-sell aren't in tension.

3

The zero state deserved more time.

• Fin •

• Fin •

Create a free website with Framer, the website builder loved by startups, designers and agencies.